
Cleaning Management Solutions
A tailor-made solution for the cleanliness of your city.
Our solution helps you manage daily cleanliness to achieve your quality of service, resource efficiency and sustainability targets. This solution comes in the form of a service (you don’t have to purchase hardware or provide us with your IT infrastructure): we ensure the smooth running of the systems whilst making the data available to you via a web interface.
Our coaches can help you achieve quantifiable results based on your targets.
Monitor. Deliver. Connect.
A solution fully integrated into your smart city
QUALITY OF SERVICE
Objective and accurate mapping of the cleanliness level (Clean City Index). Measuring urban waste types and quantities in real time (the smallest waste detected is the cigarette stub).
OPTIMISATION OF RESOURCES
Methods to identify and implement points for action based on a cleanliness diagnosis, to achieve meaningful and quantifiable results.
Smart City
Interconnectivity and data management for integration into Smart Cities approaches.
Together for quantifiable results
Supporting your cleaning management solutions project
Our method allows us to achieve measurable and sustainable progress in managing city cleanliness. Based on objectives (KPIs), diagnostics are carried out in order to prioritise the points for action to be implemented. Our coaches support your teams in the implementation of this method and in the achievement of results.

Case studies: Clean City Lab
Points for action for your teams
In our Clean City Labs, we experiment on areas for improvement with field teams. This collaboration with our partners and customers provides us with tools for optimising cleanliness services on the basis of objective data
Efficient allocation of ressources
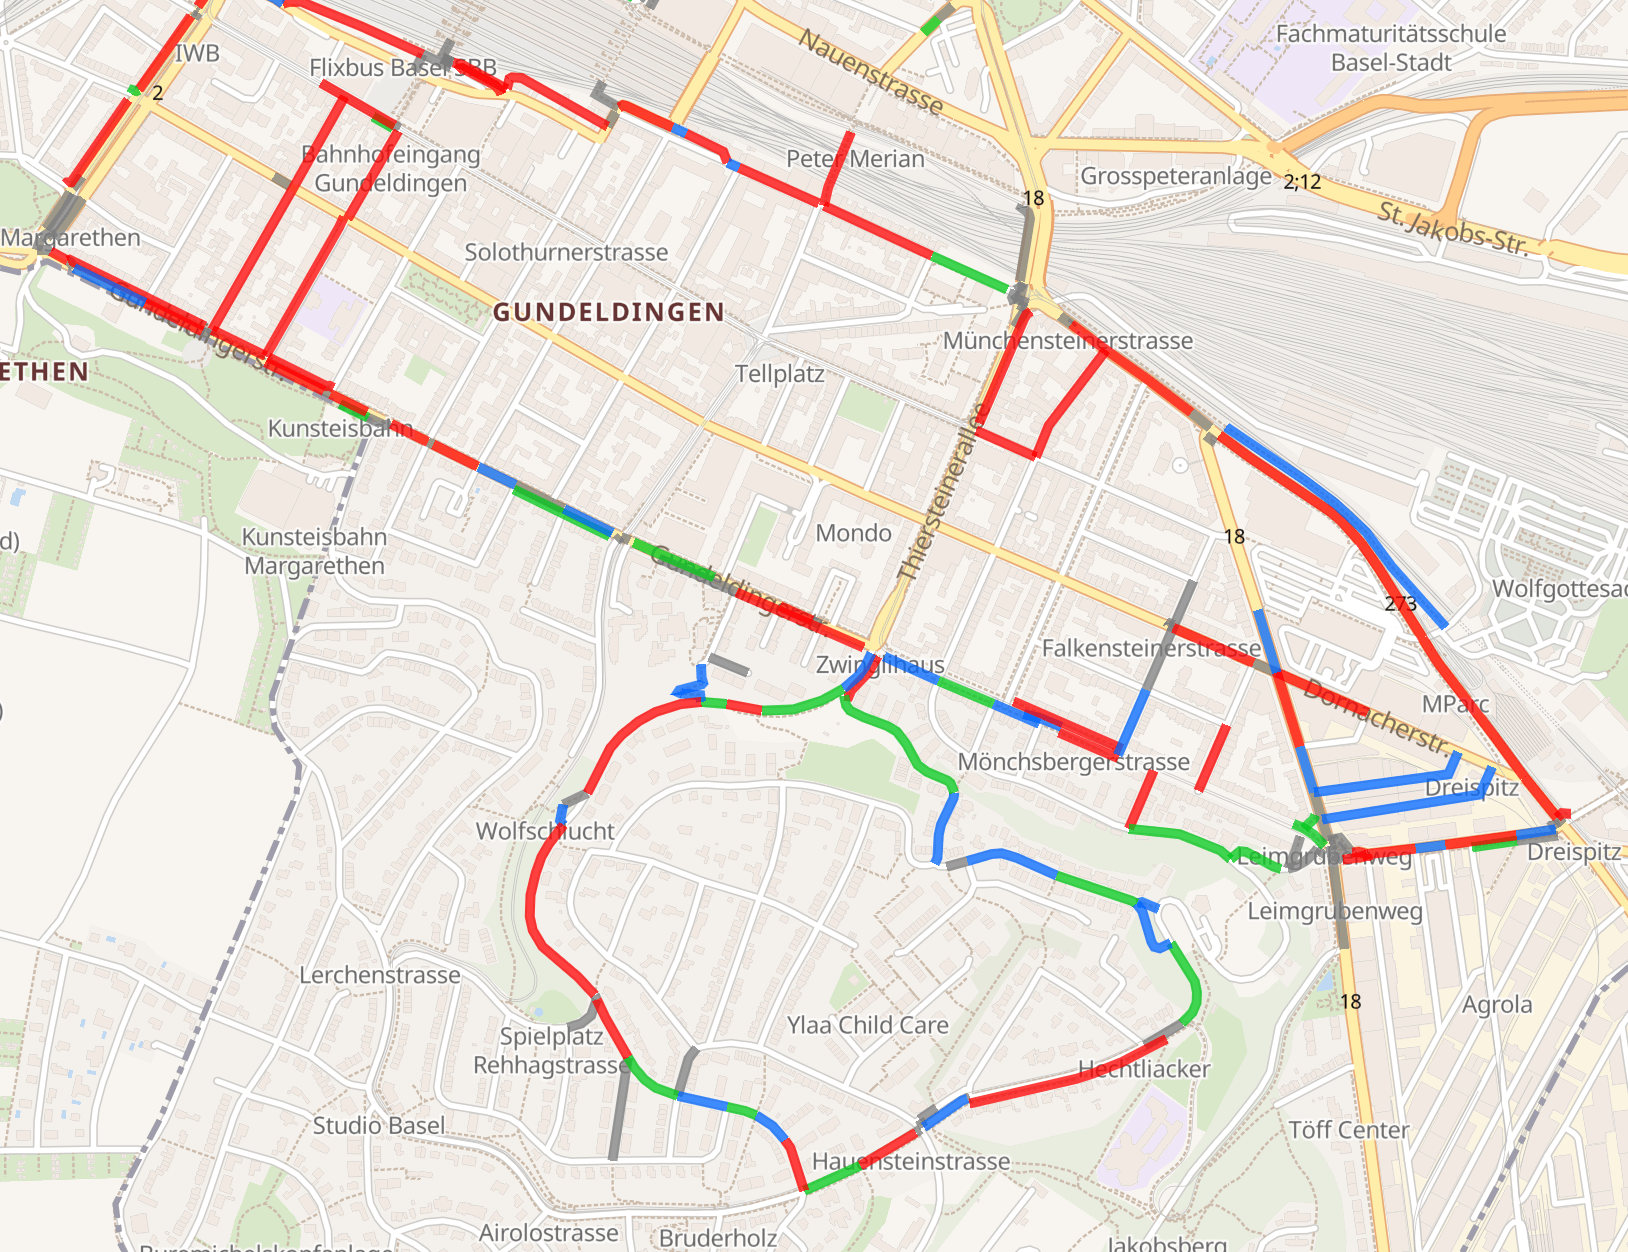
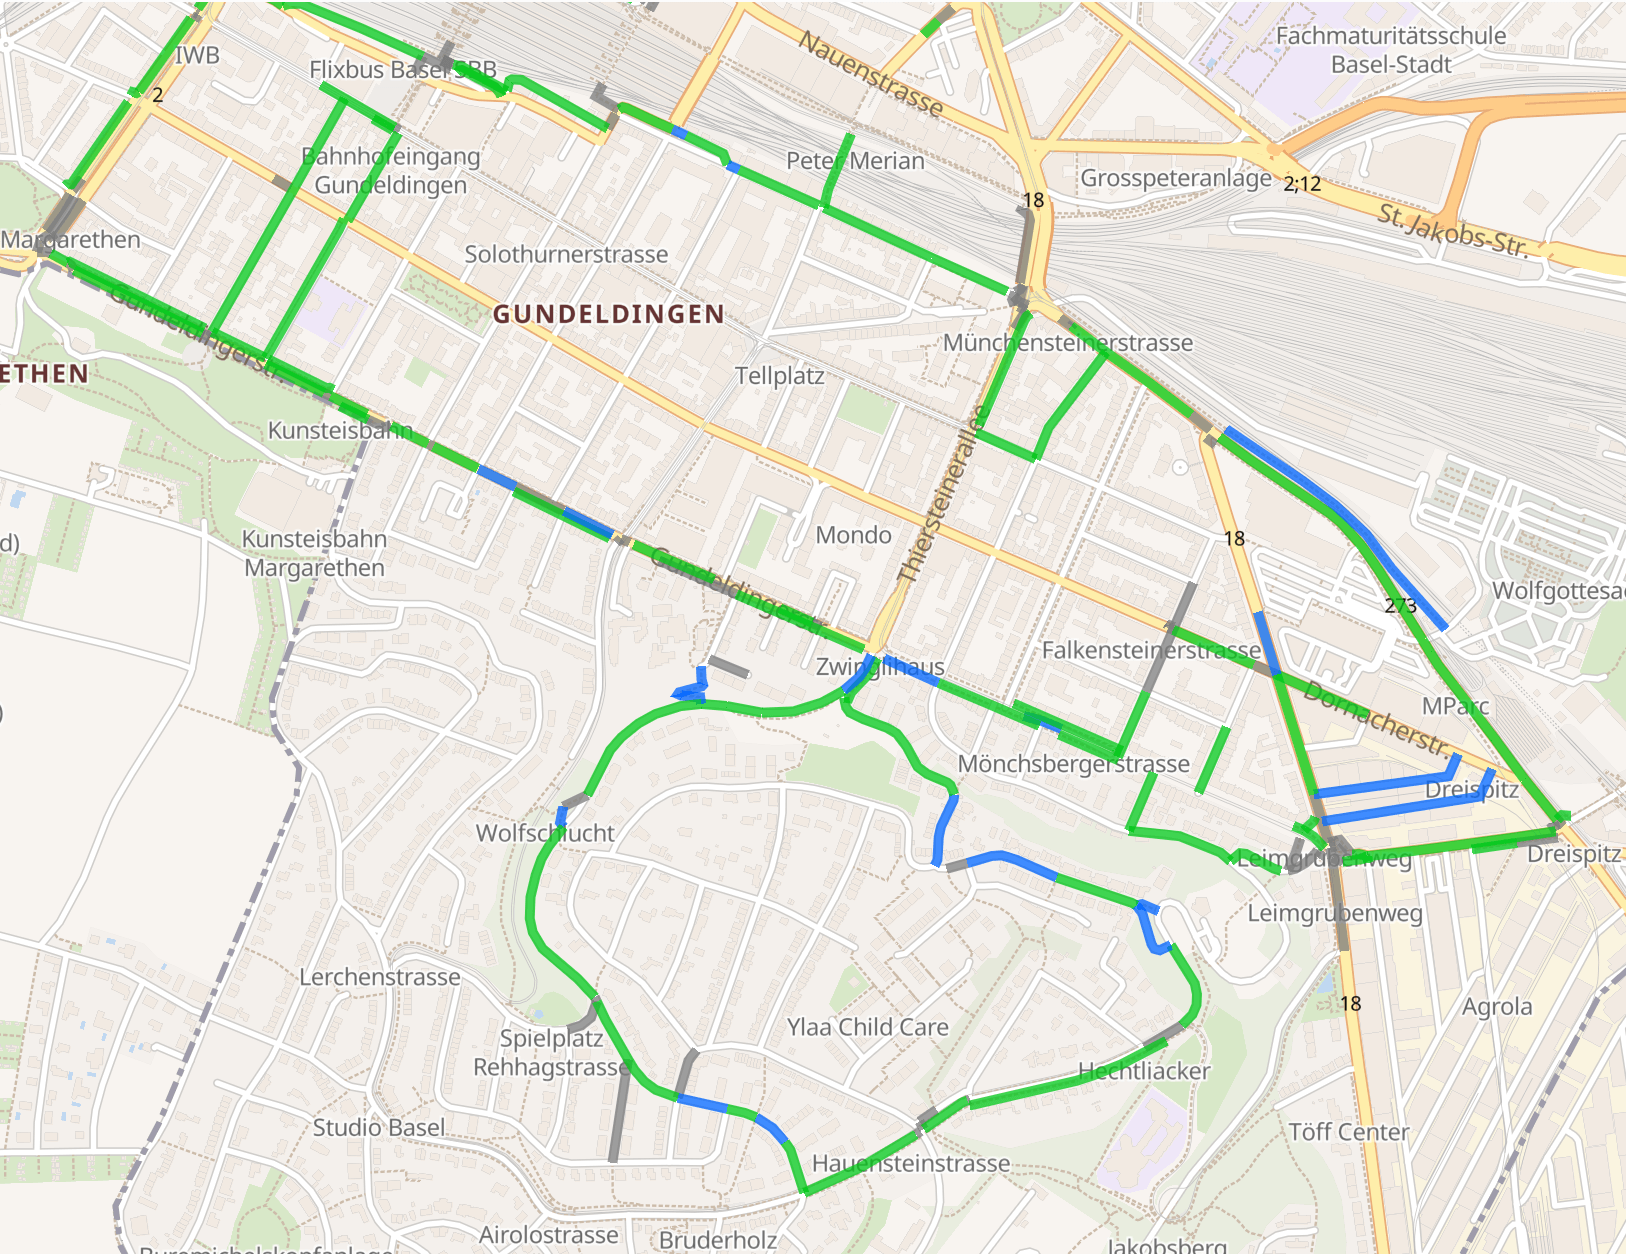
The city sets a target level of cleanliness which it wants to ensure. For example, a Clean City Index between 3.0 and 3.5. The cleanliness index is represented on the map through a colour system which allows resources to be allocated where needed:
- Green: streets and squares meet the target level of cleanliness
- Blue: these areas’ cleanliness is above the target and they do not need to be cleaned
- Red: these are the priority areas in need of cleaning.
A predominantly green map means a well-managed quality of service and efficient use of machinery and personnel.

City of geneva’s “petit voyou” anti-cigarette stubs campaign
With its “Petit voyou” (“Little rascal”) campaign, the city of Geneva ventured off the beaten track to tackle cigarette stubs littering. Initially, thanks to the monitoring, it was able to single out the areas most affected by littering. Subsequently, for each location, it identified the origin of the problems: insufficient number of ashtrays, inadequate user behaviour, etc. It then took action focused on each problem source and measured the results. This unprecedented approach earned it the AVPU’s Grand Prix d’honneur.
Optimisation of cleaning according to the period and type of waste.
The analysis of the types of waste affecting the cleanliness index permits the implementation of targeted measures to ensure an objective level of cleanliness throughout the week. For example, after having measured that the level of cleanliness is affected by bottles and cans on the weekend, this small tourist town introduced manual collection of this waste in the squares where the situation was critical.
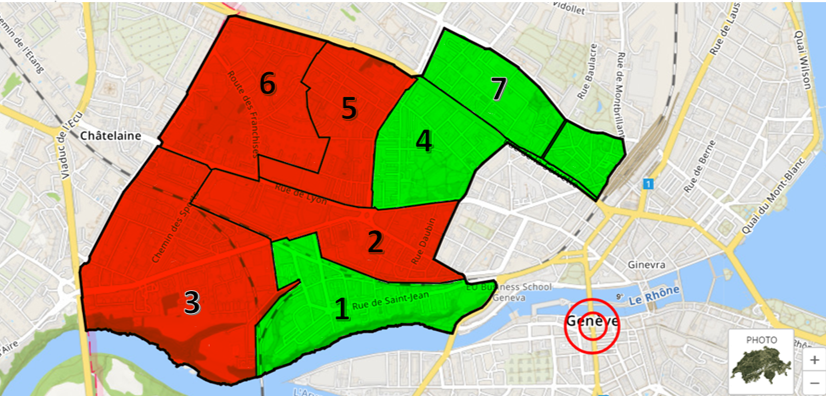
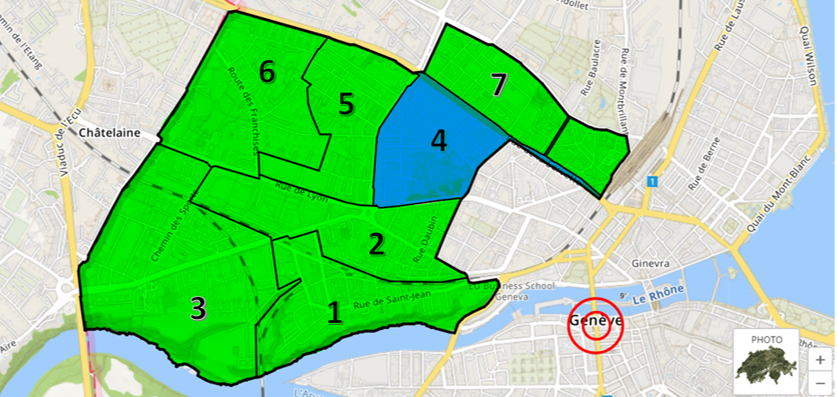
Redeployment of sweepers
In one of the City of Geneva’s road districts, the sweepers’ frequency of passage was reduced in a “blue” neighbourhood (cleanliness measured above target level) in order to increase them in a “red” neighbourhood. The results met expectations: the district’s cleanliness level was improved without increasing resources.
Cortexia SA, Route de Vevey 91, 1618 Châtel-St-Denis, Switzerland
Our solutions enable both cities and businesses to manage urban cleanliness accurately and objectively, making cities more attractive and sustainable.